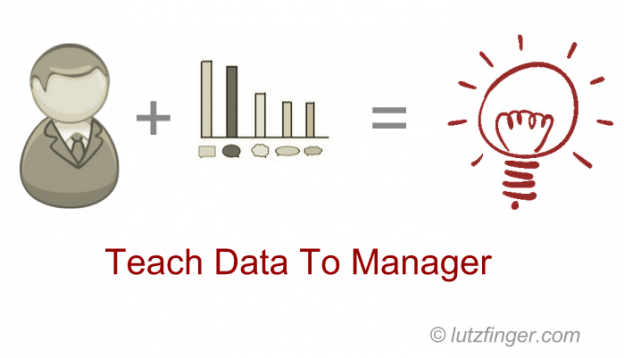
How do you create amazing new data driven products! By studying deep, deeper and the deepest machine learning algorithms? Nope – by enabling business folks to talk and think data .
Recently I had the opportunity to test this theory. I taught a course for MBA students at Cornell University’s Johnson Business School and Cornell Tech campus. In the course, we covered the basic components of data science including modeling, visualization scraping technologies and databases. At the end each team built a stunning data app: from predicting the of future Starbucks locations to setting prices for old vinyl records.

It is the business mindset that drives many of our product ideas. Thus while data scientists are tough to hire (I am hiring at LinkedIn – join our great team) it is the business focus that is missing. McKinsey recently called out that we face a shortage of about 150k Data Scientist as well as 1.5 million managers . Really? Are those data scientists so hard to manage that we need 10 managers to take care of them? No. The truth is that we are missing data minded managers as we need to include a business-related component in any data discussion. If you hear “actionable analytics,” it only means something like “business thinking inside”. Analytics should be focused on an action to improve or change our business.
My course at Cornell had two main objectives: to take away the fear of big data and to create a common language for MBAs to use. But how do we “take away the fear”? The answer is by building your own data applications. Many data science syllabi often teach students tools such as R (a programming language for statisticians), Python, and the like. Don’t get me wrong: these are great tools, but they are useless for teaching MBAs. No one will remember a few months down the road how to even load a dataset.
Thus I focus on simplicity. For data scraping we used import.io (a great tool founded by Andrew Fogg), for visualization we used plot.ly (a very simple visualization tool by Matt Sundquist) and for the predictive layer we used eitherBigML or Excel. Yes, Excel. It can – with a bit of hand-holding – recreate many Data Science models. It is learning by doing. If you want to dig into this, I highly recommend the book Data Smart from John W. Foreman.
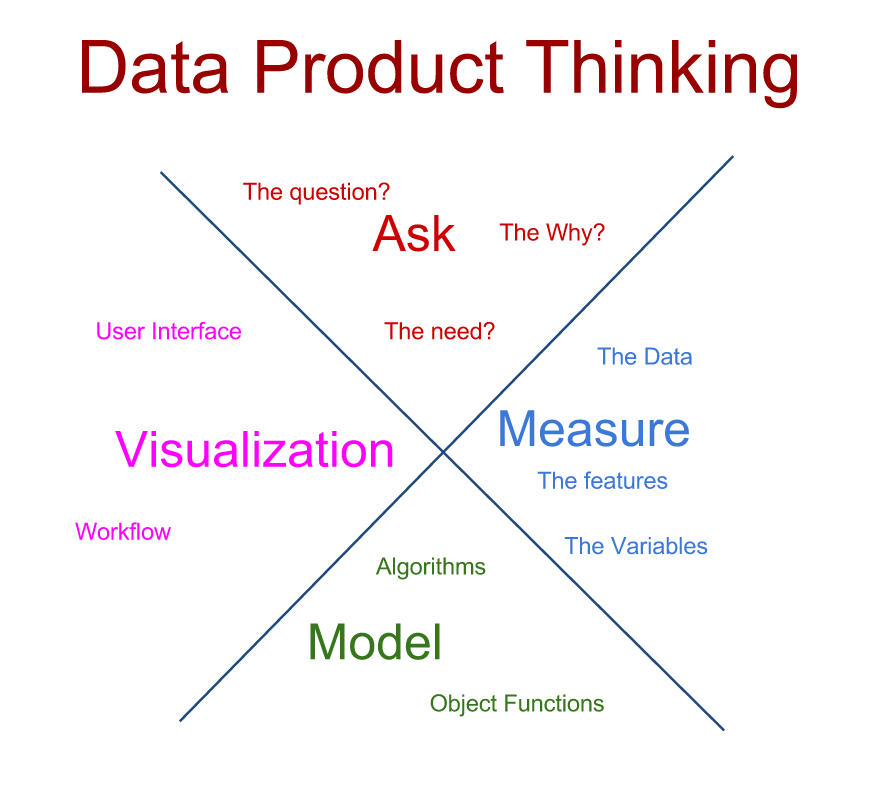
Scraping, plotting, and crunching are important… but it does not take long for any smart MBA to ask the “so what question.” So we start with a framework of actionability and applicability discussed in my recent book Ask Measure Learn(find it here). Students learn that data and algorithms are nothing if you cannot create an action or build a product.
The course finishes with a term project where teams can use any data they can get as well as any complexity of model, as long as they define their own product use-case for the app. This complete freedom created amazing results. One person who is an excited collector of vinyl records built an engine to better determine their price point. Another team built an app to find for the best location for party-and-bar-loving MBAs at a given price. Yet another team analyzed the feedback from various classes to determine how professors need to change to improve their teaching.
More important, some of these projects went far beyond being cool and made a very strong business case. Here are just two examples from our course that showcase what MBAs can do with just a little data science background:
- Jacob Jordan (Jacob Jordan) predicted with an 80% likelihood where Starbucks will open their next store. With his model, he went even further and analyzed the claim that Starbucks drives gentrification, but could not find a high correlation with typical gentrification factors.
- Students Grace Schiodtz, Sean Corriel, Santiago Kegevic Huerta, Christine Kang and Kenneth Leu took the text mining route (yes – in Excel!) by analyzing Yelp reviews and understanding what kind of words are needed for positive feedback. To me, this is a $35 million idea, because this is how much Cornell grad Ashish Gambhir raised for a very similar idea called newBrandAnalytics.
At the end of the course there were many high-quality business apps powered by data. A complete list of all project videos can be found here. This Cornell course is proof for me that in order to unleash amazing capabilities for innovation, companies need to teach business managers basic data science techniques .
This fall I will teach this course again at Harvard Business School (together withProf. Datar) as well as at Johnson’s Cornell. Let’s see what kind of innovation we will get!
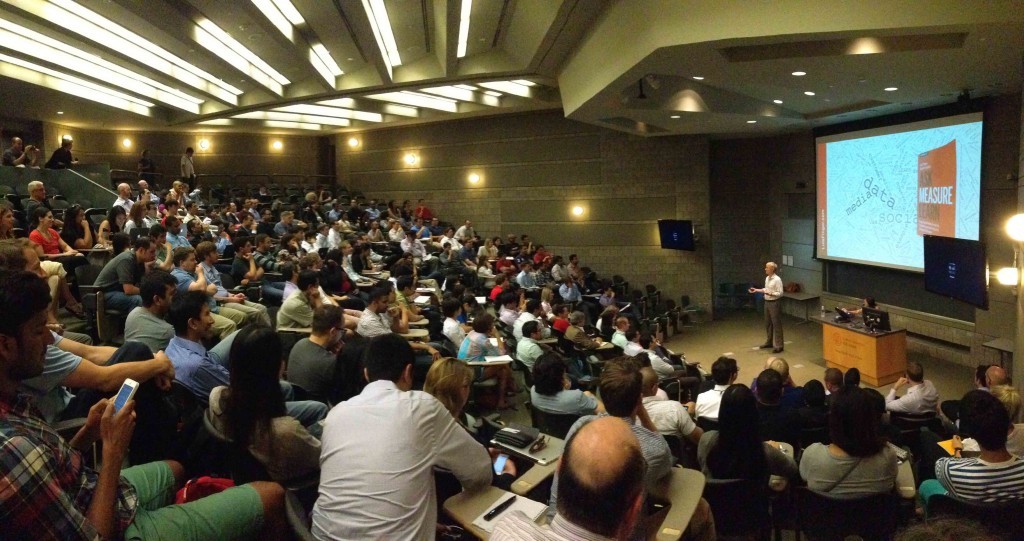
(Lutz Finger – talks about his book “Ask Measure Learn” at Cornell University (photo: Bryan Russett))
This article was first published in Forbes.